


Principle
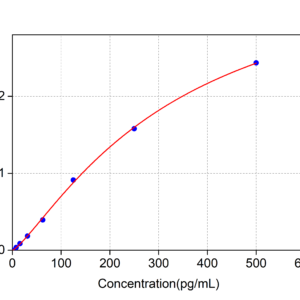
This kit uses the Sandwich-ELISA principle. The microtiter plate strips has been pre-coated with an affinity purified antibody to Mouse TNF-β. Standards or samples containing Mouse TNF-β are added to the plate and reacted with capture antibody. A second anti-Mouse TNF-β antibody labeled biotin is then added and binds to Mouse TNF-β captured on the plate. After that, Streptavidin-Horseradish Peroxidase(SA-HRP) is added to form a sandwich complex of solid phase antibody-Mouse TNF-β- biotin labeled antibody-SA-HRP. And then, TMB substrate solution is added to all wells and incubated. An enzyme-catalyzed reaction generates a blue color in the solution, thereafter, stop solution is added to stop the substrate reaction and the color turns yellow. The yellow solution is read at a wavelength of 450nm. The concentration of Mouse TNF-β in the samples is then calculated from the OD value by establishing a standard curve
Specification
| Product name | “Quanticon” Mouse TNF-β (Tumor Necrosis Factor Beta) ELISA Kit |
| Cat no | ABQ-ES96-TNFBms |
| Applications | ELISA |
| Reactivity | Mouse |
| Standard Range | 15.63-1000pg/mL |
| Sensitivity | 9.38 pg/mL |
| Sample Type | Serum, plasma, Tissue homogenates, Cell Lysates, Cell culture supernatant and other biological fluids Sample |
| Sample Volume | 100 ul |
| Alternative | LT; LTA; TNF-B; TNFSF1; Tumor Necrosis Factor Ligand Superfamily Member 1; Lymphotoxin Alpha |
| Assay Type | Sandwich |
| Assay Duration | 3.5H |
| Detection Wavelength | 450nm |
| Storage | 2-8oC |
Precision
Mean coefficient of variation for Intra-Assay and Inter-Assay: 3 samples with low, middle and high level concentration were tested for repeat multiple times, respectively.
| Item | Intra-assay Precision | Inter-assay Precision |
| Sample number | 3 | 3 |
| Replicate | 9 | 18 |
| CV(%) | 5 | 8 |
Rate of recovery
Three matrices listed below were spiked with certain level of Mouse TNF-β, the recovery rates of Mouse TNF-β were calculated by comparing the measured value to the expected amount of Mouse TNF-β in samples
| Matrix type | Recovery Range (%) | Average (%) |
| Serum (n=5) | 85-97 | 91 |
| EDTA plasma (n=5) | 85-97 | 91 |
| Cell culture media (n=5) | 83-99 | 95 |

Related products


 “Quanticon” Mouse TNF-β (Tumor...
You may add any content here from XStore Control Panel->Sales booster->Request a quote->Ask a question notification
At sem a enim eu vulputate nullam convallis Iaculis vitae odio faucibus adipiscing urna.