

Principle
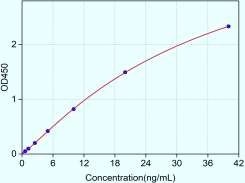
This kit uses the Sandwich-ELISA principle. The microtiter plate strips has been pre-coated with an affinity purified antibody to Human COMP. Standards or samples containing Human COMP are added to the plate and reacted with capture antibody. A second anti-Human COMP antibody labeled biotin is then added and binds to Human COMP captured on the plate. After that, Streptavidin-Horseradish Peroxidase(SA-HRP) is added to form a sandwich complex of solid phase antibody-Human COMP-biotin labeled antibody-SA-HRP. And then, TMB substrate solution is added to all wells and incubated. An enzyme-catalyzed reaction generates a blue color in the solution, thereafter, stop solution is added to stop the substrate reaction and the color turns yellow. The yellow solution is read at a wavelength of 450nm. The concentration of Human COMP in the samples is then calculated from the OD value by establishing a standard curve.
Specification
| Product name | “Quanticon” Human COMP(Cartilage Oligomeric Matrix Protein) ELISA Kit |
| Cat no | ABQ-ES96-COMPhu |
| Applications | ELISA |
| Reactivity | Human |
| Standard Range | 0.63-40ng/mL. |
| Sensitivity | 0.38 ng/mL |
| Sample Type | Serum, plasma, Tissue homogenates, Cell Lysates, Cell culture supernatant and other biological fluids Sample |
| Sample Volume | 100 ul |
| Alternative | MED; EDM1; EPD1; PSACH; THBS5; TSP-5; Pseudoachondroplasia,Epiphyseal Dysplasia 1,Multiple; Thrombospondin 5 |
| Assay Type | Sandwich |
| Assay Duration | 3.5H |
| Detection Wavelength | 450nm |
| Storage | 2-8oC |
Precision
Mean coefficient of variation for Intra-Assay and Inter-Assay: 3 samples with low, middle and high level concentration were tested for repeat multiple times, respectively.
| Item | Intra-assay Precision | Inter-assay Precision |
| Sample number | 3 | 3 |
| Replicate | 9 | 18 |
| CV(%) | 5 | 8 |
Rate of recovery
Three matrices listed below were spiked with certain level of Human COMP, The recovery rates of Human COMP were calculated by comparing the measured value to the expected amount of Human COMP in samples.
| Matrix type | Recovery Range (%) | Average (%) |
| Serum (n=5) | 80-96 | 87 |
| EDTA plasma (n=5) | 87-95 | 91 |
| Cell culture media (n=5) | 96-107 | 102 |

Related products


 “Quanticon” Human COMP(Cartila...
You may add any content here from XStore Control Panel->Sales booster->Request a quote->Ask a question notification
At sem a enim eu vulputate nullam convallis Iaculis vitae odio faucibus adipiscing urna.